Analytics
Compare pass rates, attendance, ratings and survey results across classes, see who needs attention, and track how much training the team delivers.
Your words may differ. Each workspace can choose its own words: a class might be a cohort, program or group, a learner a participant, trainee or new hire, a session a module or lesson. These guides use the default words. The steps are the same whatever your workspace calls them. Change your workspace's words
Analytics looks across all your classes at once. It answers three questions, one per view: how well are learners doing (Outcomes), who needs help right now (Pulse), and how much training is the team delivering (Volume). Everything is worked out from what trainers already record, so there's nothing extra to fill in.
Open Analytics
In the sidebar, click More, then Analytics.
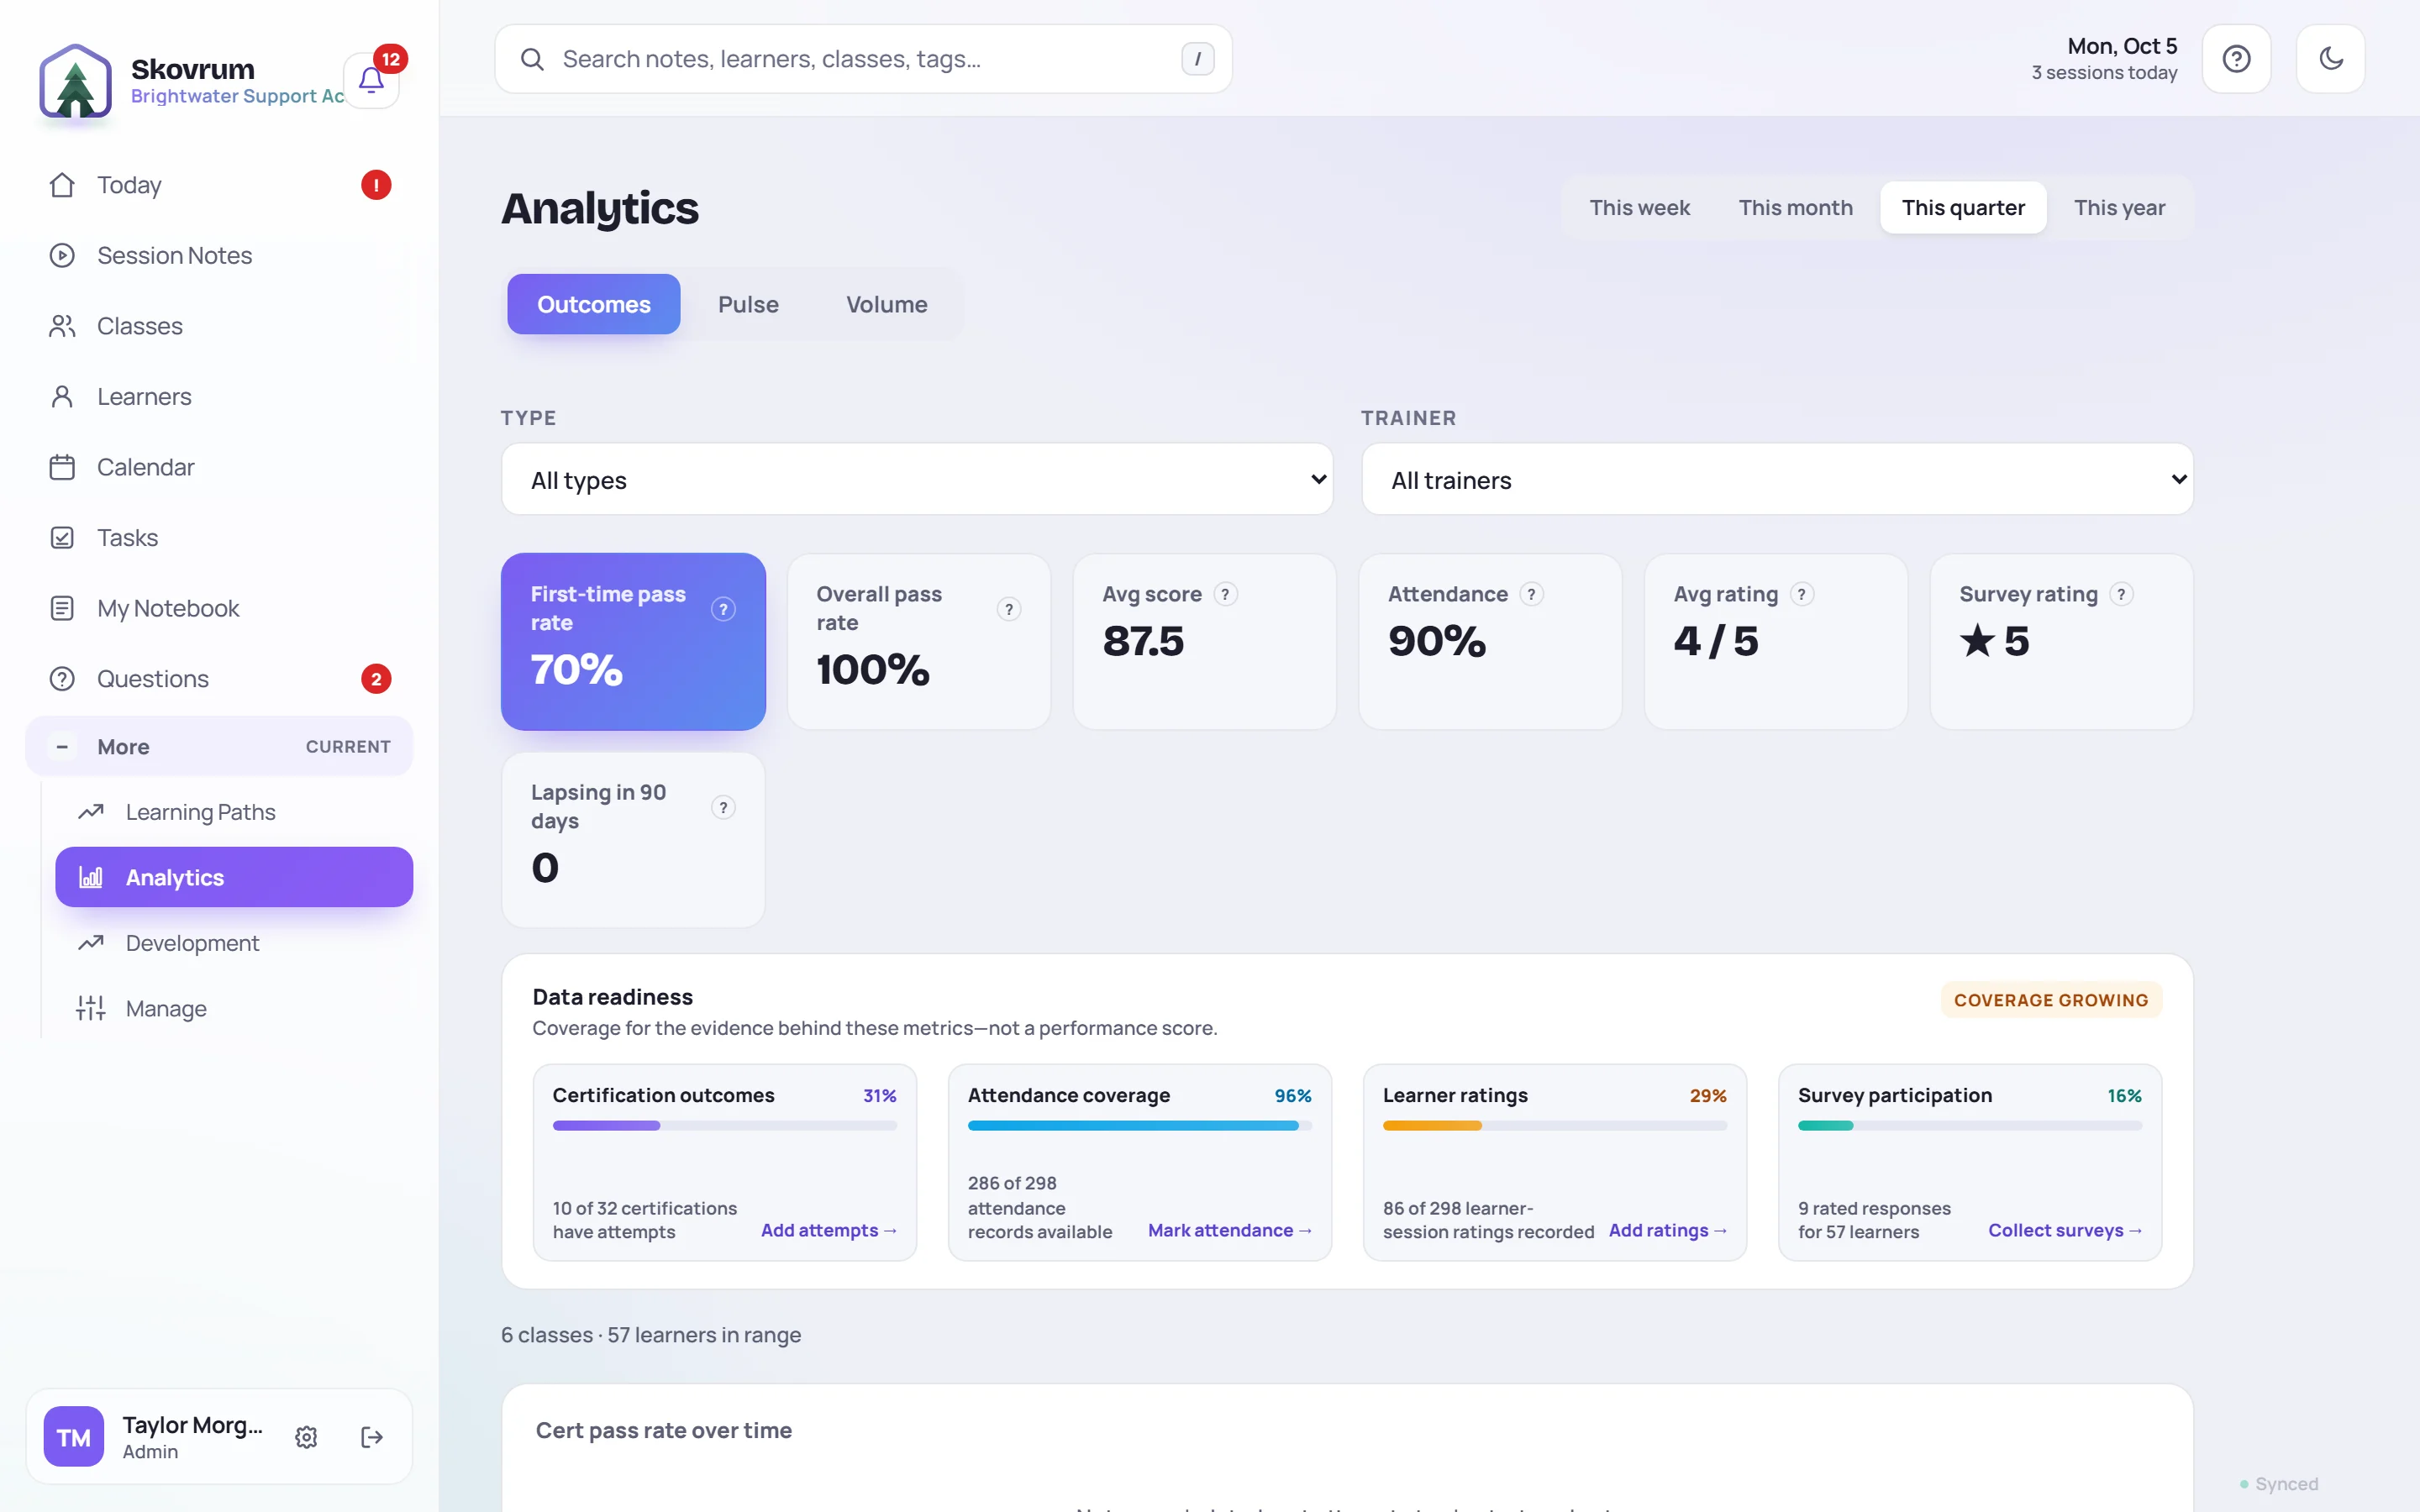
At the top:
- The range: This week, This month, This quarter (the default) or This year. Ranges count back from today, so This week is the last seven days, This month the last month, This quarter the last three months and This year the last twelve months.
- The views: Outcomes, Pulse and Volume.
- The filters: Type (onboarding, workshop or development) and Trainer (the class's primary trainer). If your workspace has added countries, there's a Country filter, and if it groups classes by affiliate, Audience (internal or client) and an affiliate filter too.
Filters apply to all three views. Analytics includes every class your role can see.
Outcomes
Seven headline numbers. Hover over the ? on any card to see its definition.
| Number | What it means |
|---|---|
| First-time pass rate | The share of learners who passed a certification on their first recorded attempt. It measures how ready people were, not whether they got there in the end. |
| Overall pass rate | The share of attempted certifications that are passed now, after any number of attempts. Retakes raise this without changing the first-time rate. |
| Avg score | The average of each learner's best recorded score per certification. |
| Attendance | Sessions marked Present, divided by all attendance records except upcoming and excused ones. Late and UEL don't count as present. |
| Avg rating | The average progress rating trainers gave learners in sessions (1 to 5). |
| Survey rating | The average rating learners gave in end-of-training surveys, plus custom survey questions that rate the trainer. End-of-day ratings aren't included. |
| Lapsing in 90 days | Learners from these classes whose certification expires in the next 90 days, using each learner's latest expiry. See Track renewals. |
Each certification is judged against its own pass mark, so a class with a 70% and a 95% certification is scored fairly. See How certifications work.
A card with nothing to measure yet says Awaiting data, with what's missing and a link to fix it, such as Record attendance →.
Data readiness
Under the numbers, Data readiness shows how complete the records behind them are. It's coverage for the evidence behind these metrics—not a performance score.

| Bar | Counts |
|---|---|
| Certification outcomes | Certifications with at least one attempt, out of all certifications on the rosters |
| Attendance coverage | Attendance records available, out of learner-sessions in the range |
| Learner ratings | Learner-sessions with a progress rating, out of learner-sessions in the range |
| Survey participation | Rated survey responses, compared with the number of learners |
The label on the right sums it up: Getting started, Coverage growing or Strong coverage. Low coverage means a number above rests on a handful of records, so read it with care. Each bar's link takes you to the place to fill the gap.
Pass rate over time, and By trainer
Cert pass rate over time charts the share of attempts that passed, month by month in the range. It needs dated attempts in at least two months; until then it says Not enough dated cert attempts to chart a trend yet.
By trainer compares primary trainers: pass rate, attendance, average rating and number of learners, best pass rate first.
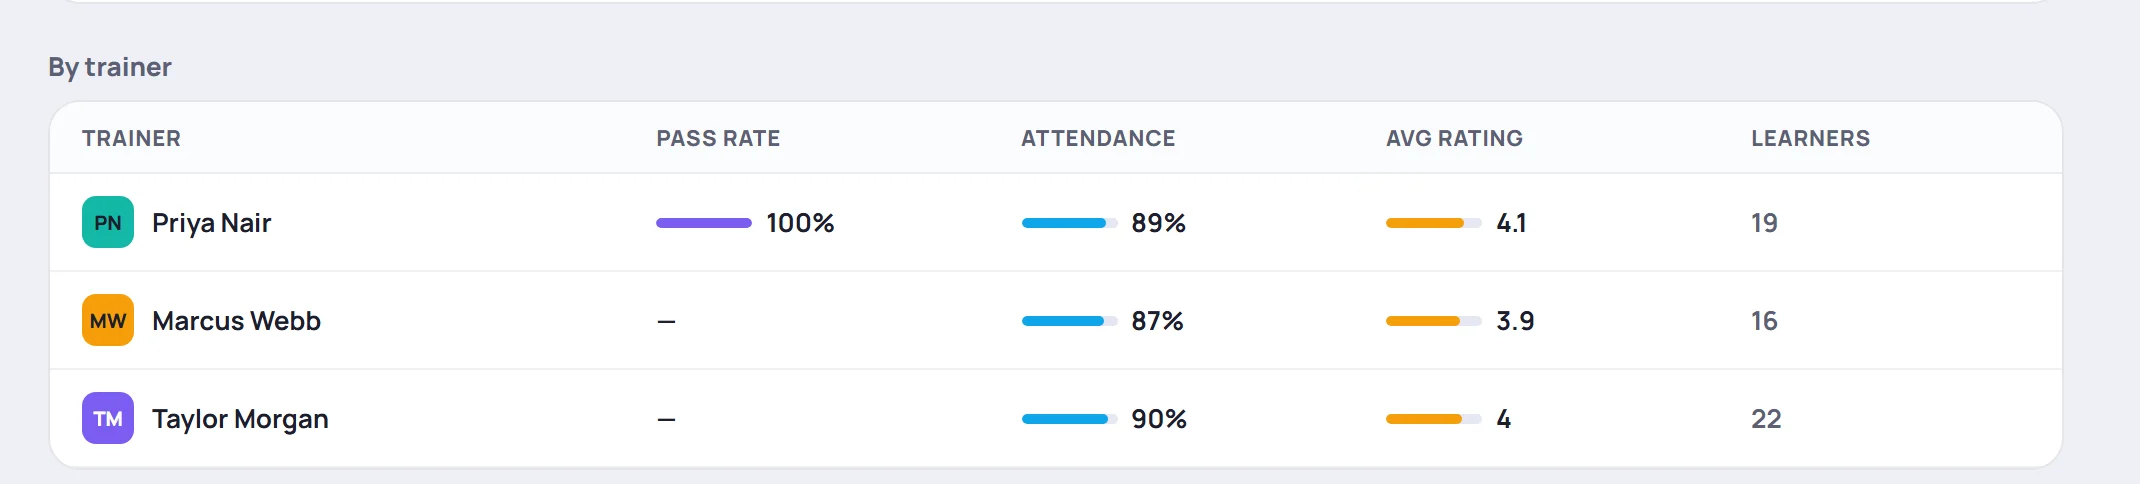
Read it as a conversation starter, not a ranking. Classes differ in size, type and who's in them.
Pulse
Pulse is for this week's decisions: who needs help and what's still open.
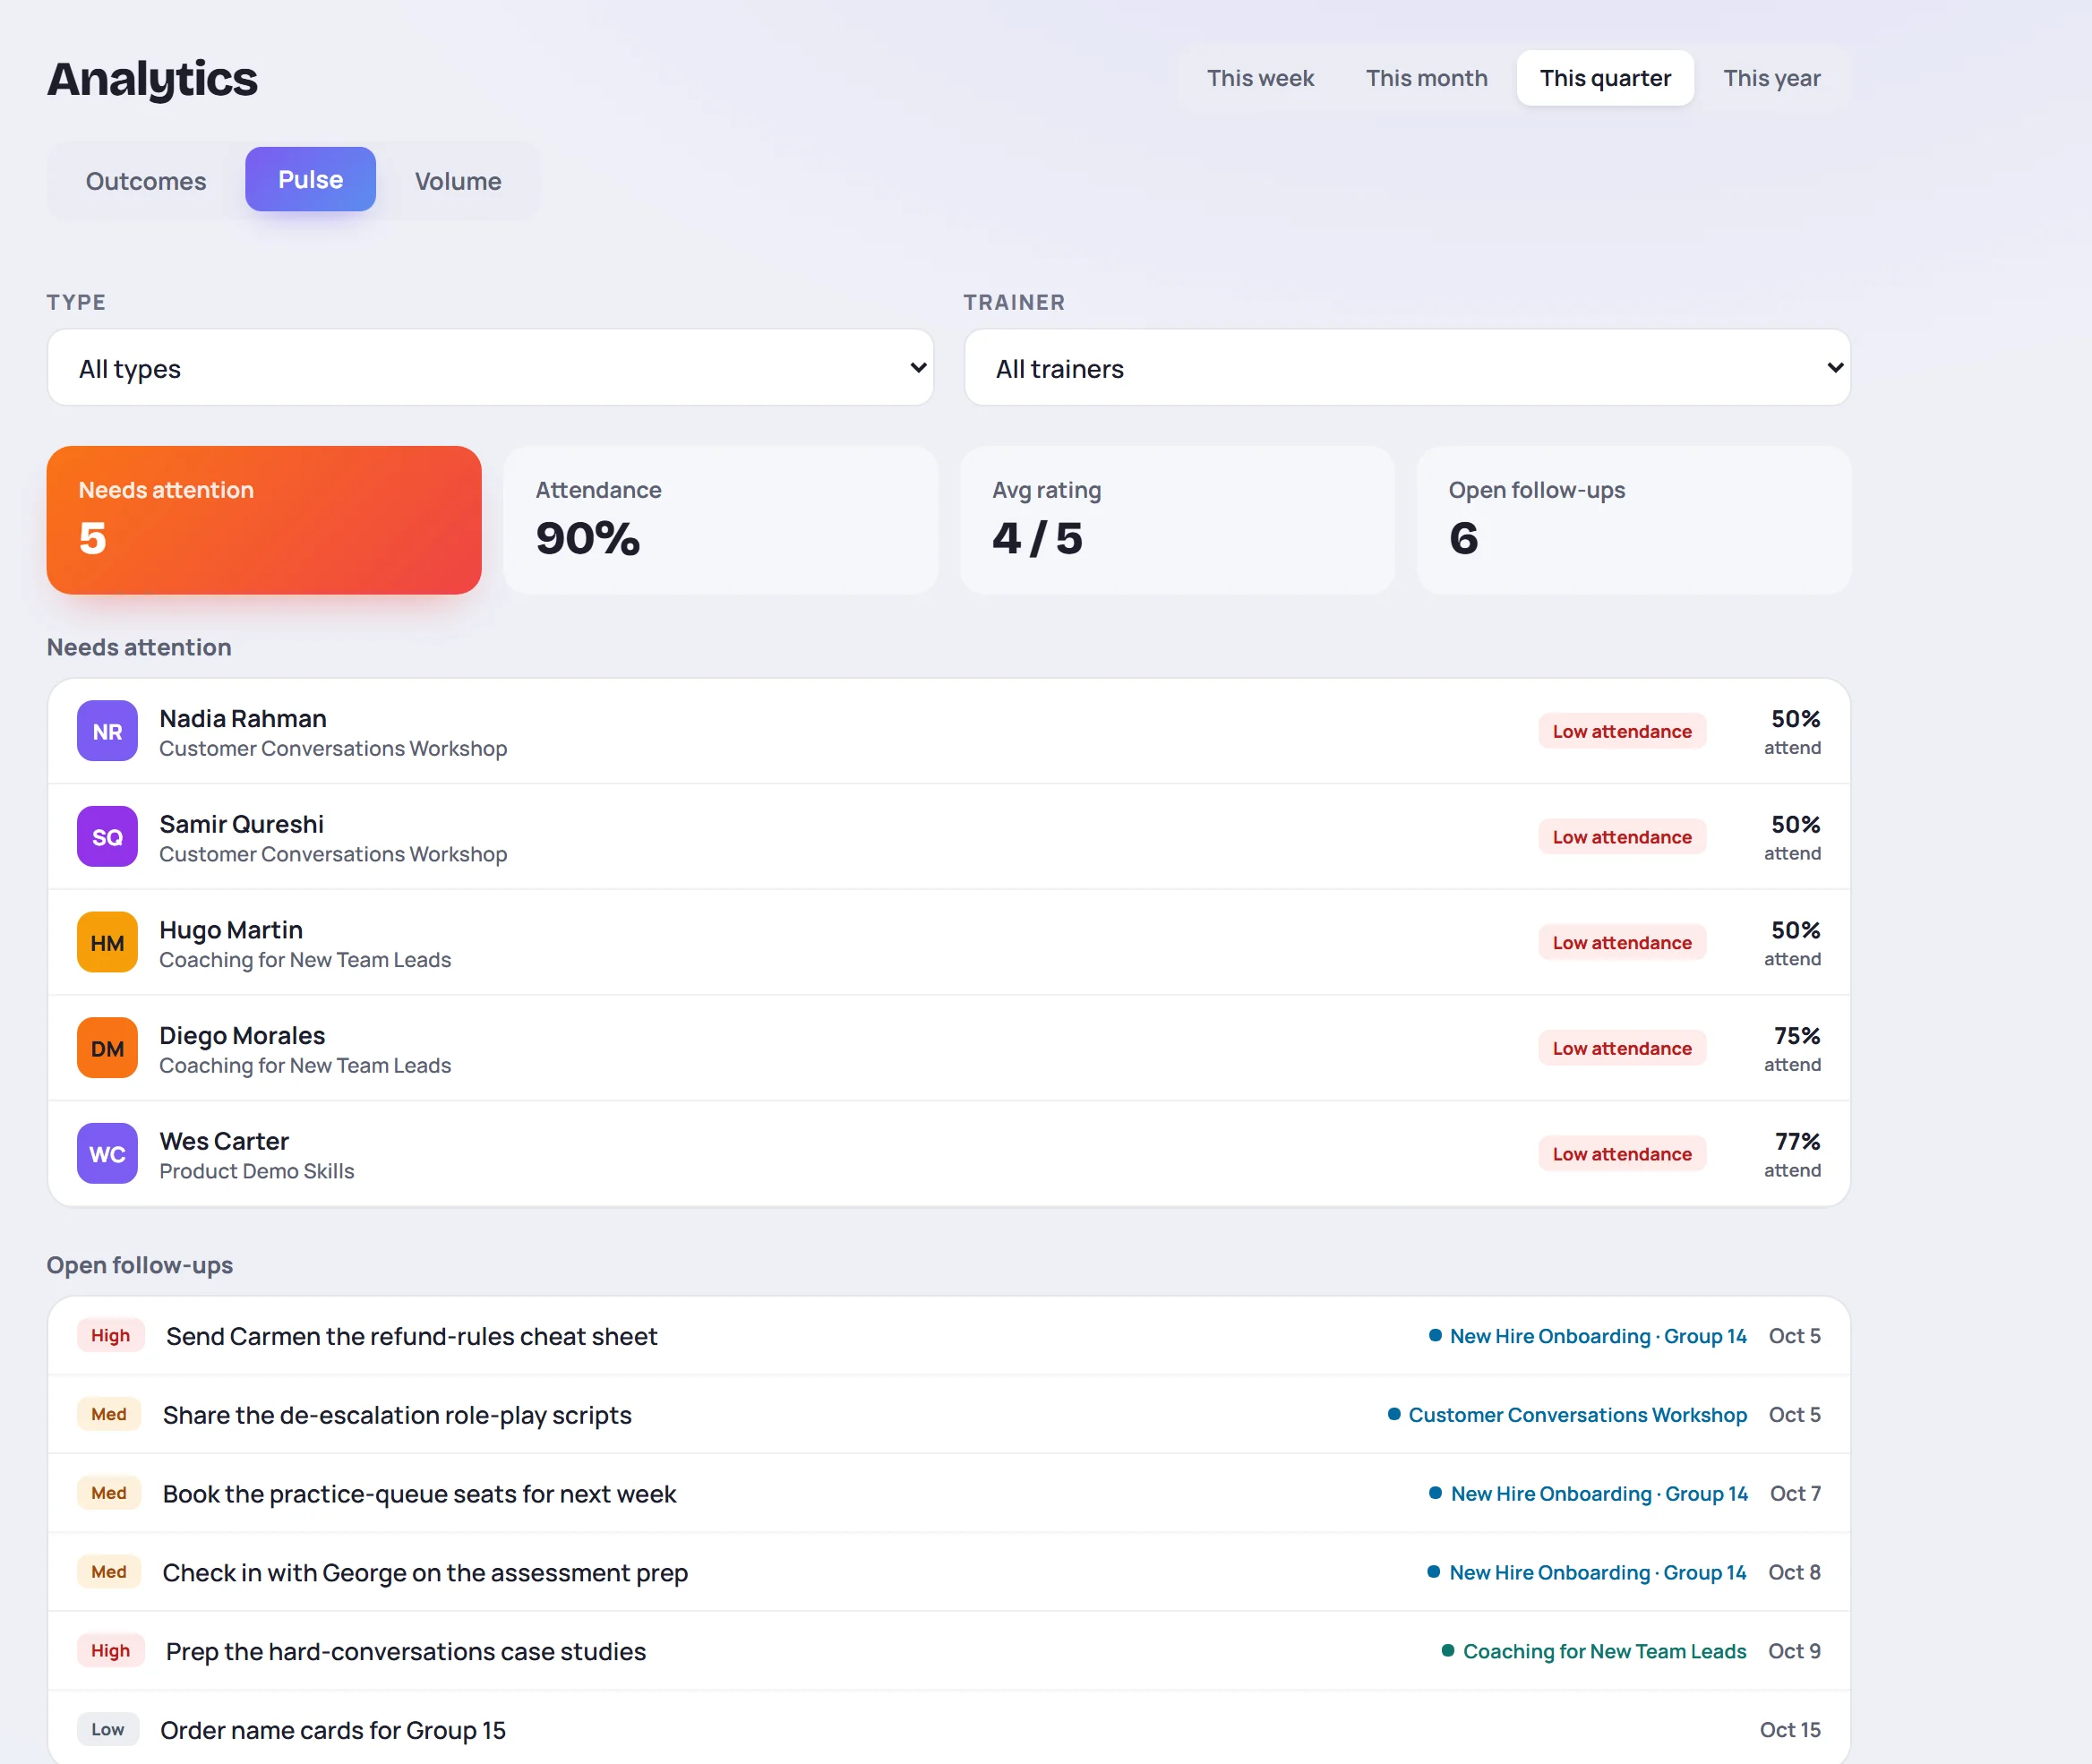
- Needs attention lists learners with at least one warning sign, most serious first: - Low attendance: under 80% in the range. - … certs unpassed: a certification attempted but not passed yet. - Low rating: an average progress rating of 2 or lower in the range.
Up to 20 learners are shown. The thresholds are the same as for the learner health labels.
- Attendance and Avg rating for the range, as on Outcomes.
- Open follow-ups counts open tasks for these classes (and tasks with no class). The list shows the eight due soonest. No open follow-ups. Nice work. means they're all done.
Volume
Volume counts output, for reporting upward.
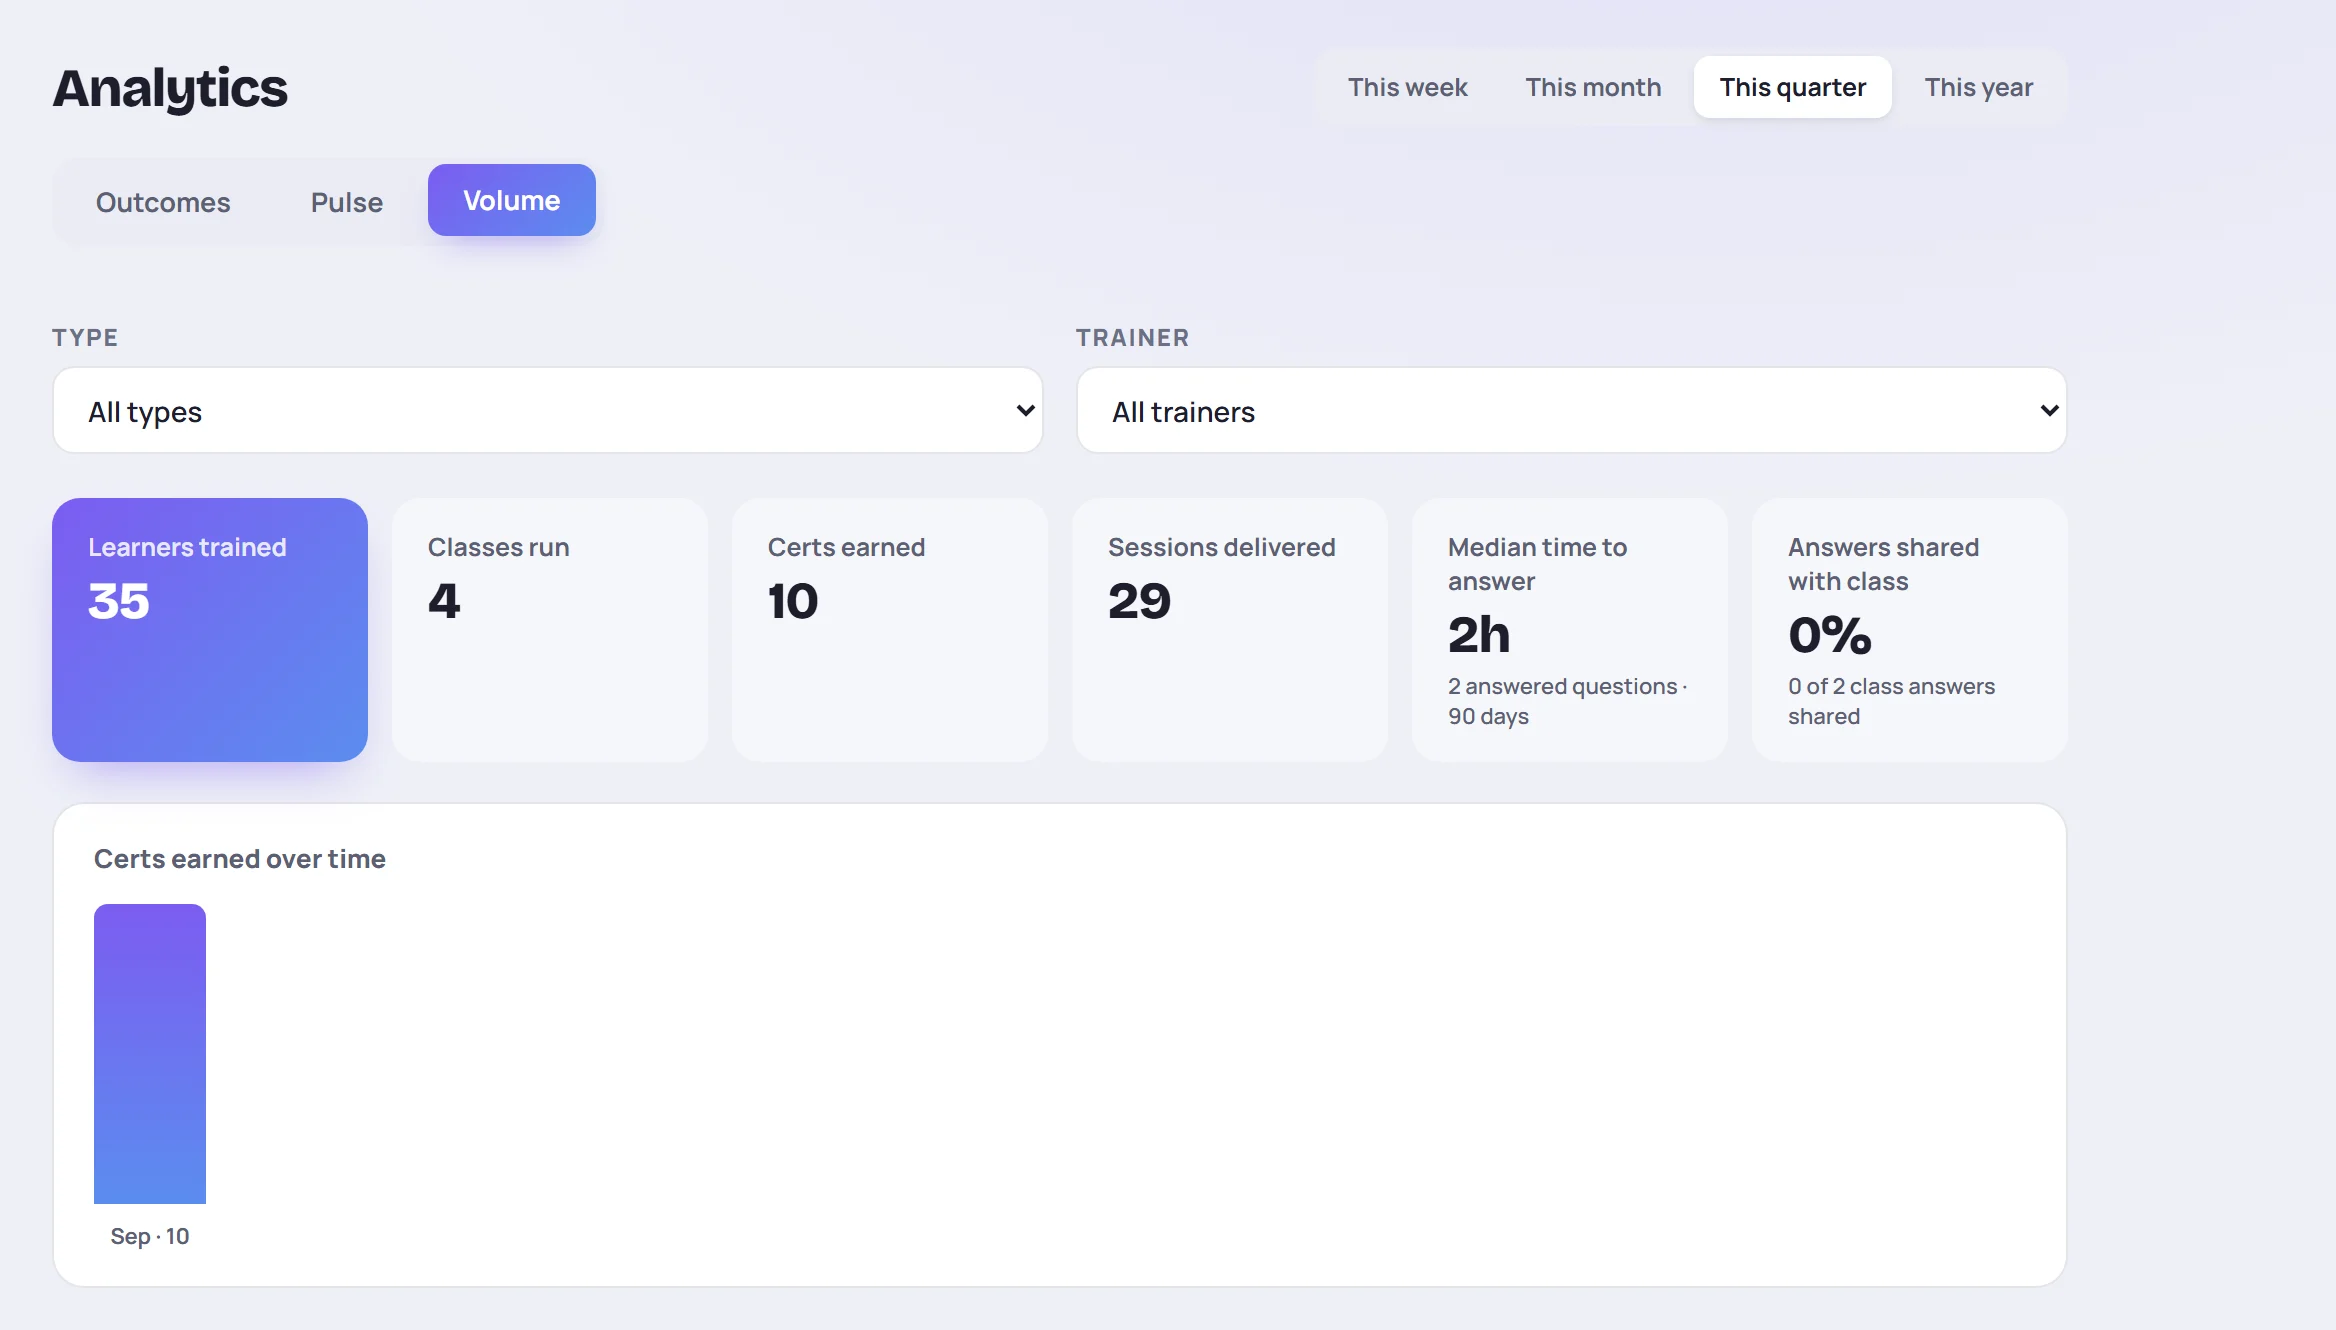
| Number | Counts |
|---|---|
| Learners trained | Learners in classes that started in the range |
| Classes run | Classes that started in the range |
| Certs earned | Certifications first passed in the range |
| Sessions delivered | Sessions held in the range, up to today |
| Median time to answer | For questions asked in the last 90 days, the typical time from asking to an accepted answer |
| Answers shared with class | Of the answered class questions from the last 90 days, the share marked as shared with the class |
The two question numbers always cover the last 90 days and every question you can see, whatever the range and filters say. See Use the parking lot.
Certs earned over time shows certifications earned per month. With affiliates switched on, a By affiliate table splits classes, learners and certifications by affiliate.
Common questions
Why don't I see Analytics? Your role doesn't include View analytics. Ask an Admin.
The numbers look too good, or too bad. Check Data readiness first. A 100% pass rate from two attempts says little. Also, a session with no attendance taken counts everyone as present.
Why is a trainer missing from By trainer? It groups by each class's primary trainer, and only shows trainers whose classes have learners. Co-trainers' work counts toward the primary trainer's row.
Can I export these numbers? Not from Analytics itself. Use the CSV exports for the underlying records, or a class report for one class.